In this post, I discuss Thingsboard and my internet-of-things (IoT) project whose data can be viewed at https://huntershives.com/iot/graph.html.
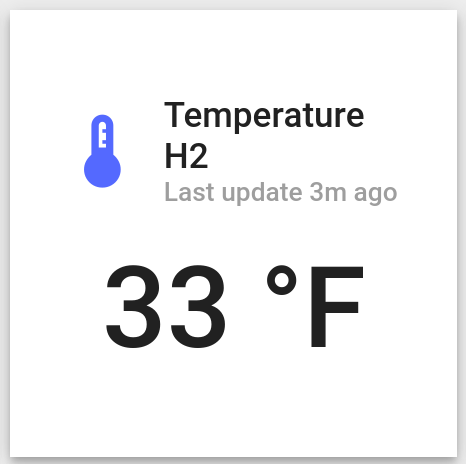
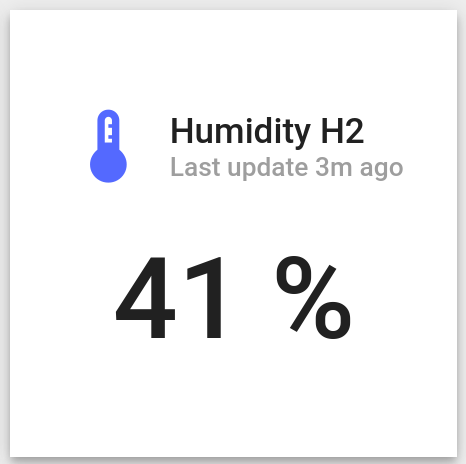
ThingsBoard is an open source service I have running on my developmental network. Incoming data (from an Arduino board with an attached sensor) is uploaded to a Postgres database and read by ThingsBoard. The service has a nice user interface that allows for ‘widgets’ to display the data. For example, my sensor outside the beehive, capturing external conditions, shows:
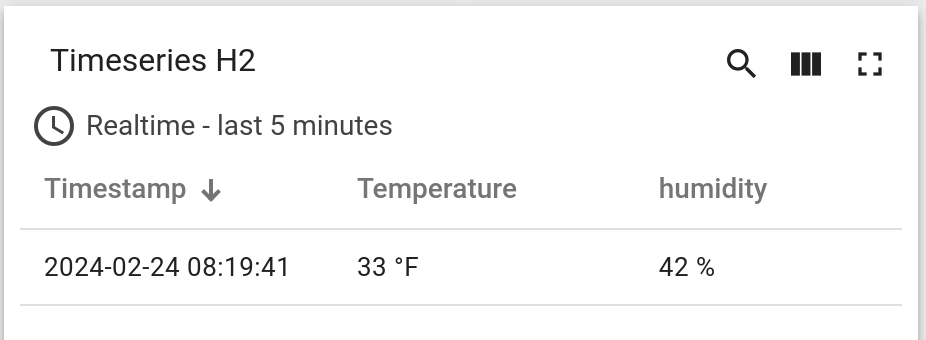
‘Dashboards’ can be created from a number of ‘widgets’. For example, timeseries can be shown in both table and graph form:
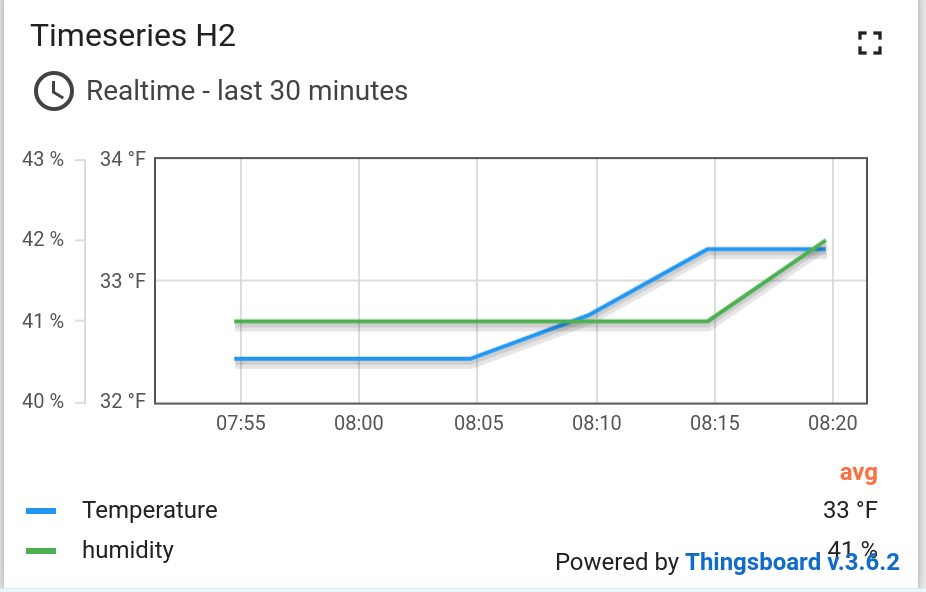
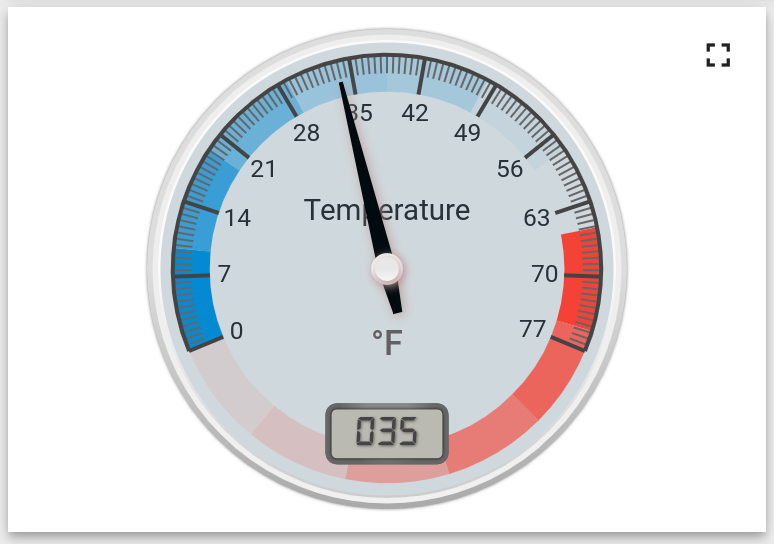
There are also a number of other graphical widgets, such as the following:
Since my developmental network is closed, I am able to see the data within a specific network/area. Of course, the usefulness is obviously greater if I am able to view this data outside of my developmental network and wherever I have an internet connection. This reality came to fruition over the course of the last half of this year.
A separate post will provide more information and detail the specifics of what I use to accomplish this, but you can view up-to-date information at https://huntershives.com/iot/graph.html.